Quick 5-Minute Guide to the Gantt Chart in Redmine
2025-04-14
•
Tags: 5-minute
•


Redmine is a powerful open-source project management tool, and one of its most useful built-in features is the Gantt chart. This quick guide will walk you through what it is, how to use it, and the features that make it especially handy for project planning.
Table of Contents
What Is the Gantt Chart Feature?

A Gantt chart visually maps out your project timeline by breaking down tasks into smaller units and showing their order and progress. It’s widely used in project management to get a clear view of task schedules — including when tasks begin and end, what’s on track, and what’s running behind.
Redmine includes this functionality by default. When you create an issue and set the start and due dates, it’s automatically displayed on the Gantt chart.
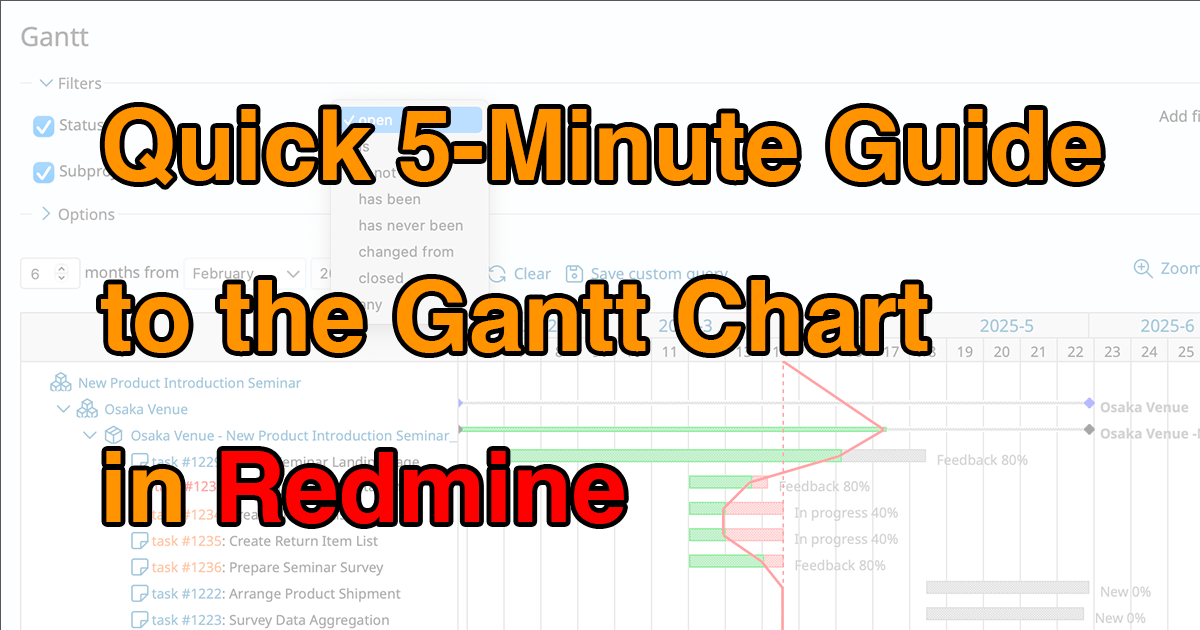
Navigating the Gantt Chart Screen

Click the Gantt chart tab from the project menu to open the chart. You can choose to view just one project, or display all projects across your Redmine instance on a single timeline.
On the chart, issues are listed vertically, while the horizontal axis represents time. Each issue appears as a bar showing its scheduled start and end dates, current progress, and status.
You can narrow down which issues are displayed by using filters. For example, set the status filter to "Open" to only show tasks that are still in progress.
Useful Features of the Gantt Chart
Time Scale and Display Period

The horizontal axis shows time — including year, month, week number, and day. You can choose the start date and display range (e.g., “6 months”) from dropdown menus in the top-left corner. After setting your preferences, click Apply to refresh the view, or Clear to reset. You can also save your custom view for later.
Need to zoom in or out? Use the Zoom In and Zoom Out buttons in the top-right corner to adjust the time scale. You can also move the chart forward or backward by month using the adjacent arrow links.
Pop-up Information

When you hover over an issue bar on the chart, a pop-up window appears showing key details like the issue title. It also includes a link to the full issue page, so you can quickly jump to it and take action if needed.
Progress Line

The progress line connects points on each bar based on the current completion percentage, creating a zigzag pattern across the chart.
To enable it, open the Options menu and check the box labeled "display" under Progress Line. If the line extends to the right of today’s date, it indicates that the task is ahead of schedule. If it extends to the left, the task is likely behind schedule.
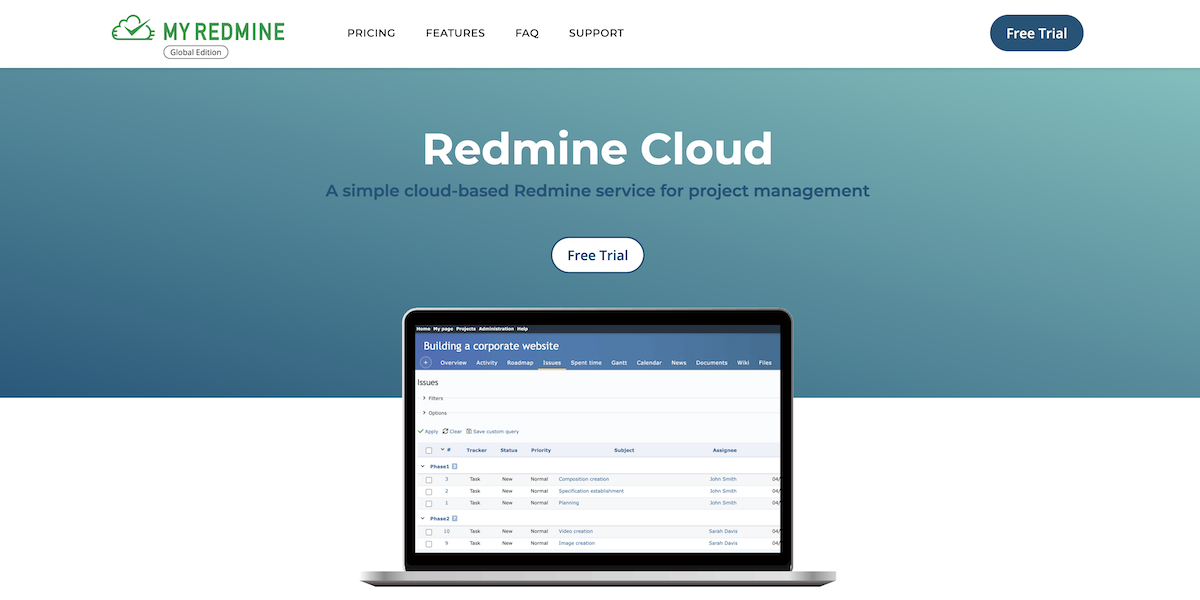
Explore Redmine's capabilities firsthand on the demo site: demo.redminecloud.net
Return to the "Quick 5-Minute Guide to Redmine" Article List